Enterprise JVM Administration and Jenkins Performance
From: https://www.cloudbees.com/blog/enterprise-jvm-administration-and-jenkins-performance
- it was common knowledge that the JVM needed three things in order to function: CPU, RAM, and disk space.
- when the JVM ran out of memory, you added more.
- if you had no more to give, you needed a few hundred bucks for more RAM sticks.
- this was common practice: feed the JVM more resources!


as of Java 1.7, PermGen space, which is where your classes, thread stacks and garbage collection among other things take place, was a finitely defined amount of memory;
with Java 1.8, PermGen was replaced with Metaspace;
the big difference between the two was that Metaspace has no default limitation, and can grow unbounded;
the important thing to remember about a Garbage Collection cycle is that it is a stop-the-world event, this means that during runtime, no other threads will execute until the GC cycle is complete;
ever wonder why your login is taking a long time? It's very possible you are suffering from a poorly tuned GC cycle which is affecting all end-users of the application;
as of JDK 1.8, if you are using a 4GB+ heap size, and your application has a low latency and high throughput requirement, then using the G1GC collector, is the right choice;
KISS principle: most systems work best if they are kept simple rather than made complex;
scale before you fail;
assuming your host has 32GB of RAM, limiting heap sizes to 16GB is the best practice;
why can't I go to 24GB heap size?
as you grow your heap size, remember that you still have to allow for Metaspace, as well as resources for the operating system;
while the default max heap size is 1/4 of physical memory, most JVM's I've encountered are "safe" to use up to 1/2;
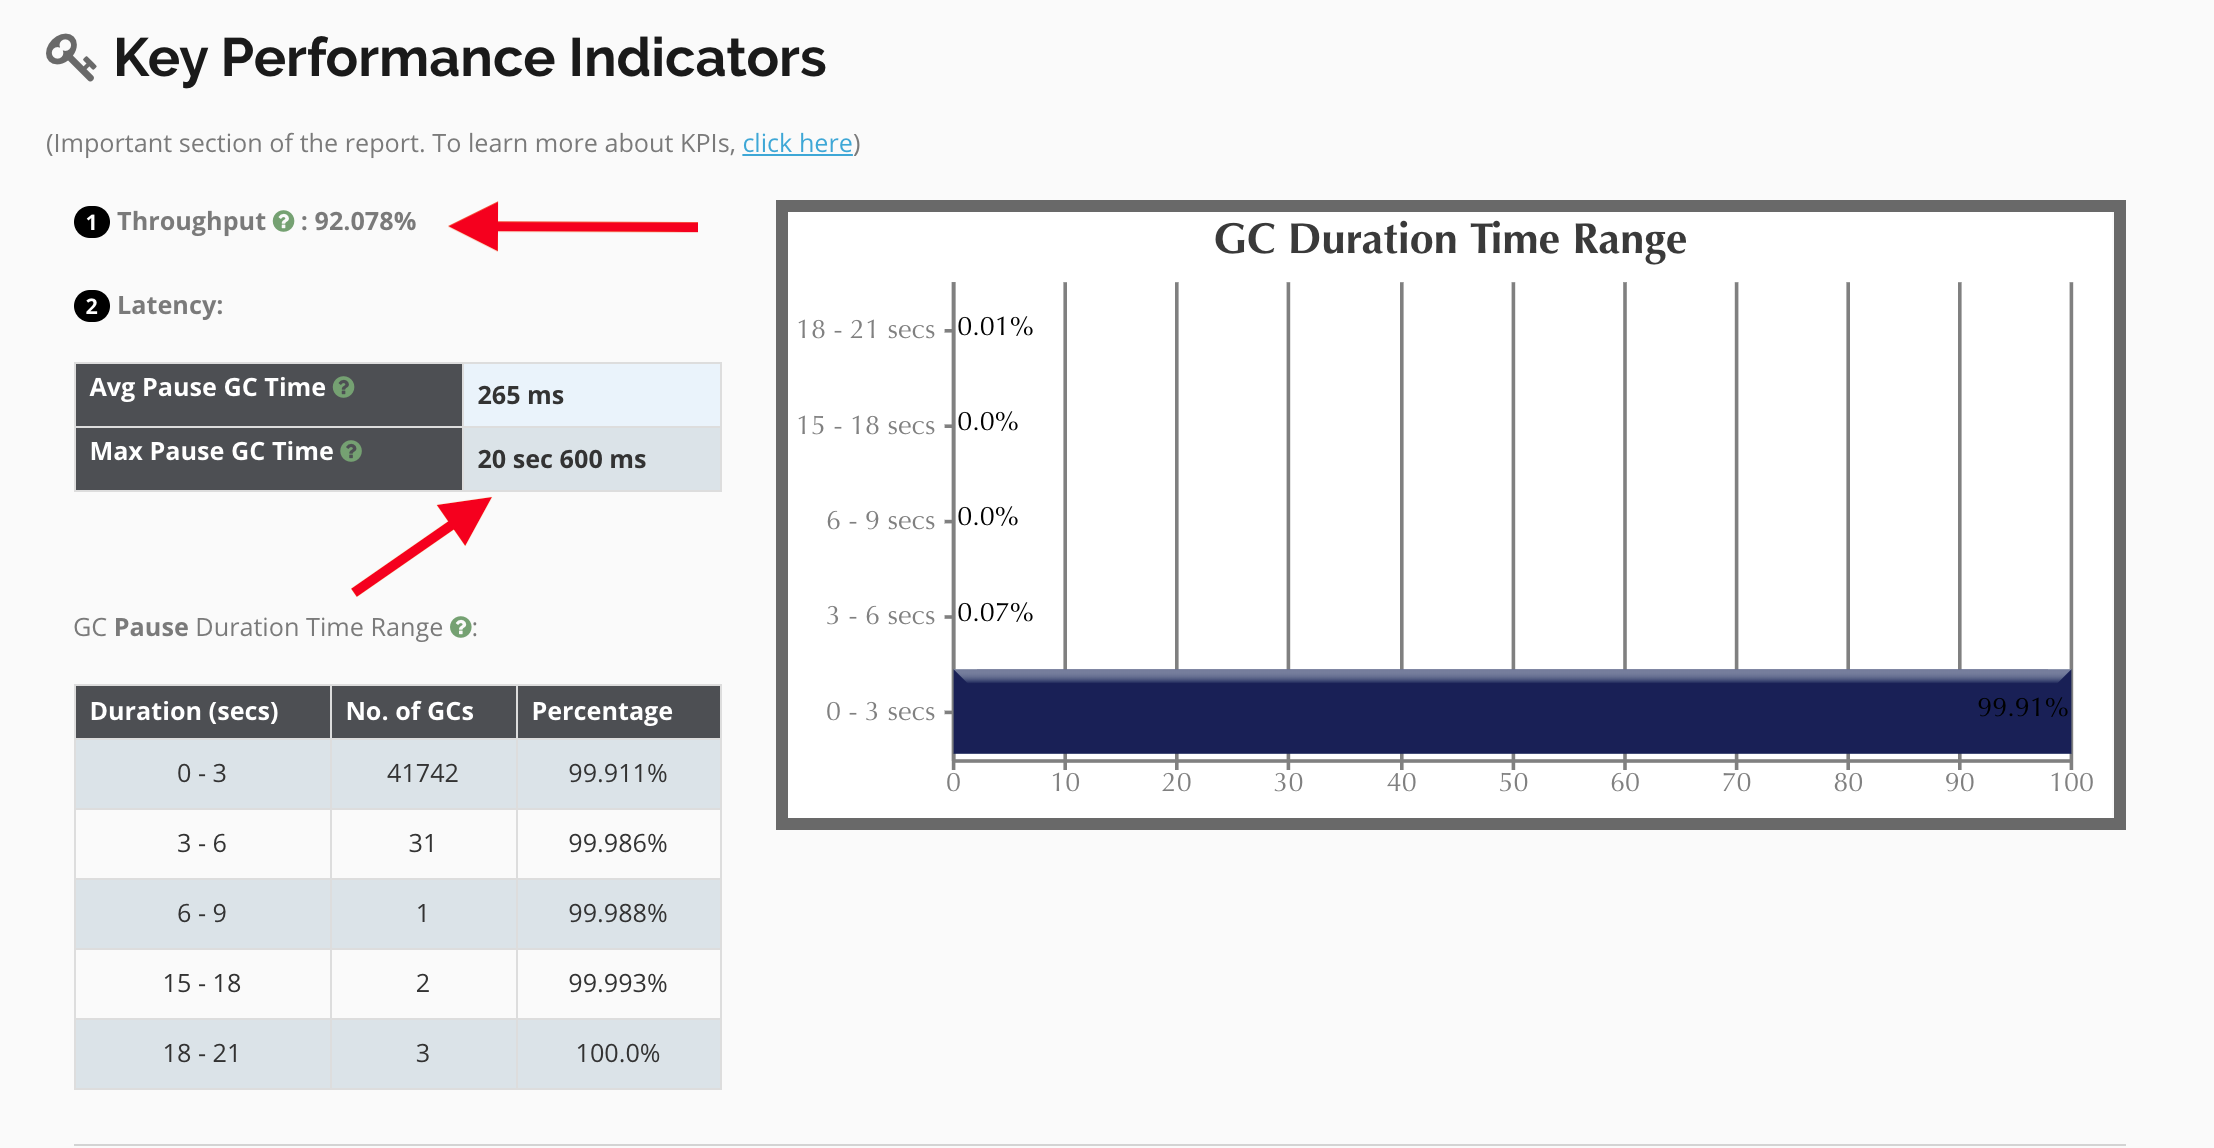
note that the application throughput is at ~92%, it means that about ~8% of the time, the application is waiting for GC;
remember, these are stop-the-world events, so during this time no other threads are moving, including login and http requests;
we aim to keep a healthy throughput at ~99%;
note that max pause GC time is +20s wait times; this explains the UI slowness reported;
we want to ideally see this number <1s;
note that in this 72 hour period there were ~42k+ GC cycles;
after an analysis of the JVM arguments in place, it was found that several arguments were forcing the G1 algorithm to work overtime to keep within the constraints of the argument limitations;
examples of unwanted arguments:
-XX:-UseAdaptiveSizePolicy
-XX:G1NewSizePercent=20
-XX: MaxMetaspaceExpansion=64M
-XX:G1SummarizeRSetStatsPeriod=1
-XX:G1HeapRegionSize=4m
-XX:MetaspaceSize=1024m
-XX:MaxMetaspaceSize=2048m
all of those arguments have overhead to the JVM and force the GC to work outside of its default algorithms;
removing these args was recommended and ultimately led to a resolution;
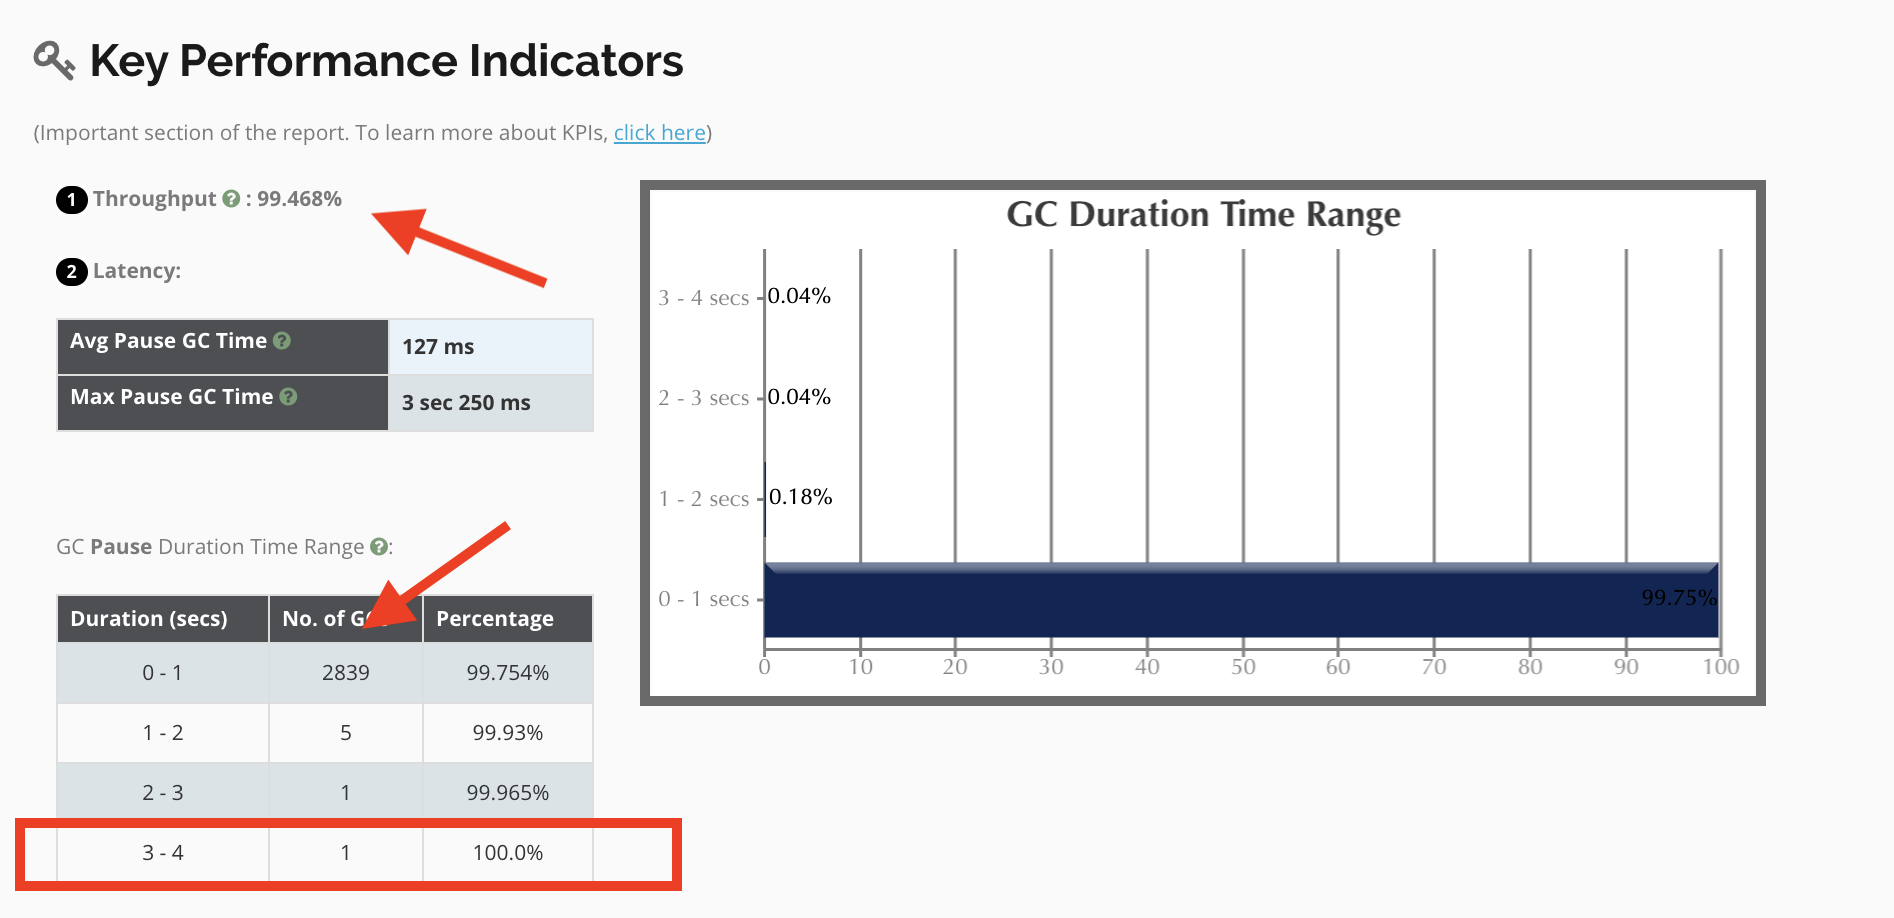
removing the JVM args that were causing overhead ultimately allowed the GC algorithm to do what it was intended to do without having to operate with a wrench in its cogs;
another example;
it was noted that the following JVM args were being set and it was recommended to remove them
-XX:G1NewSizePercent=20
-XX:MaxMetaspaceExpansion=64m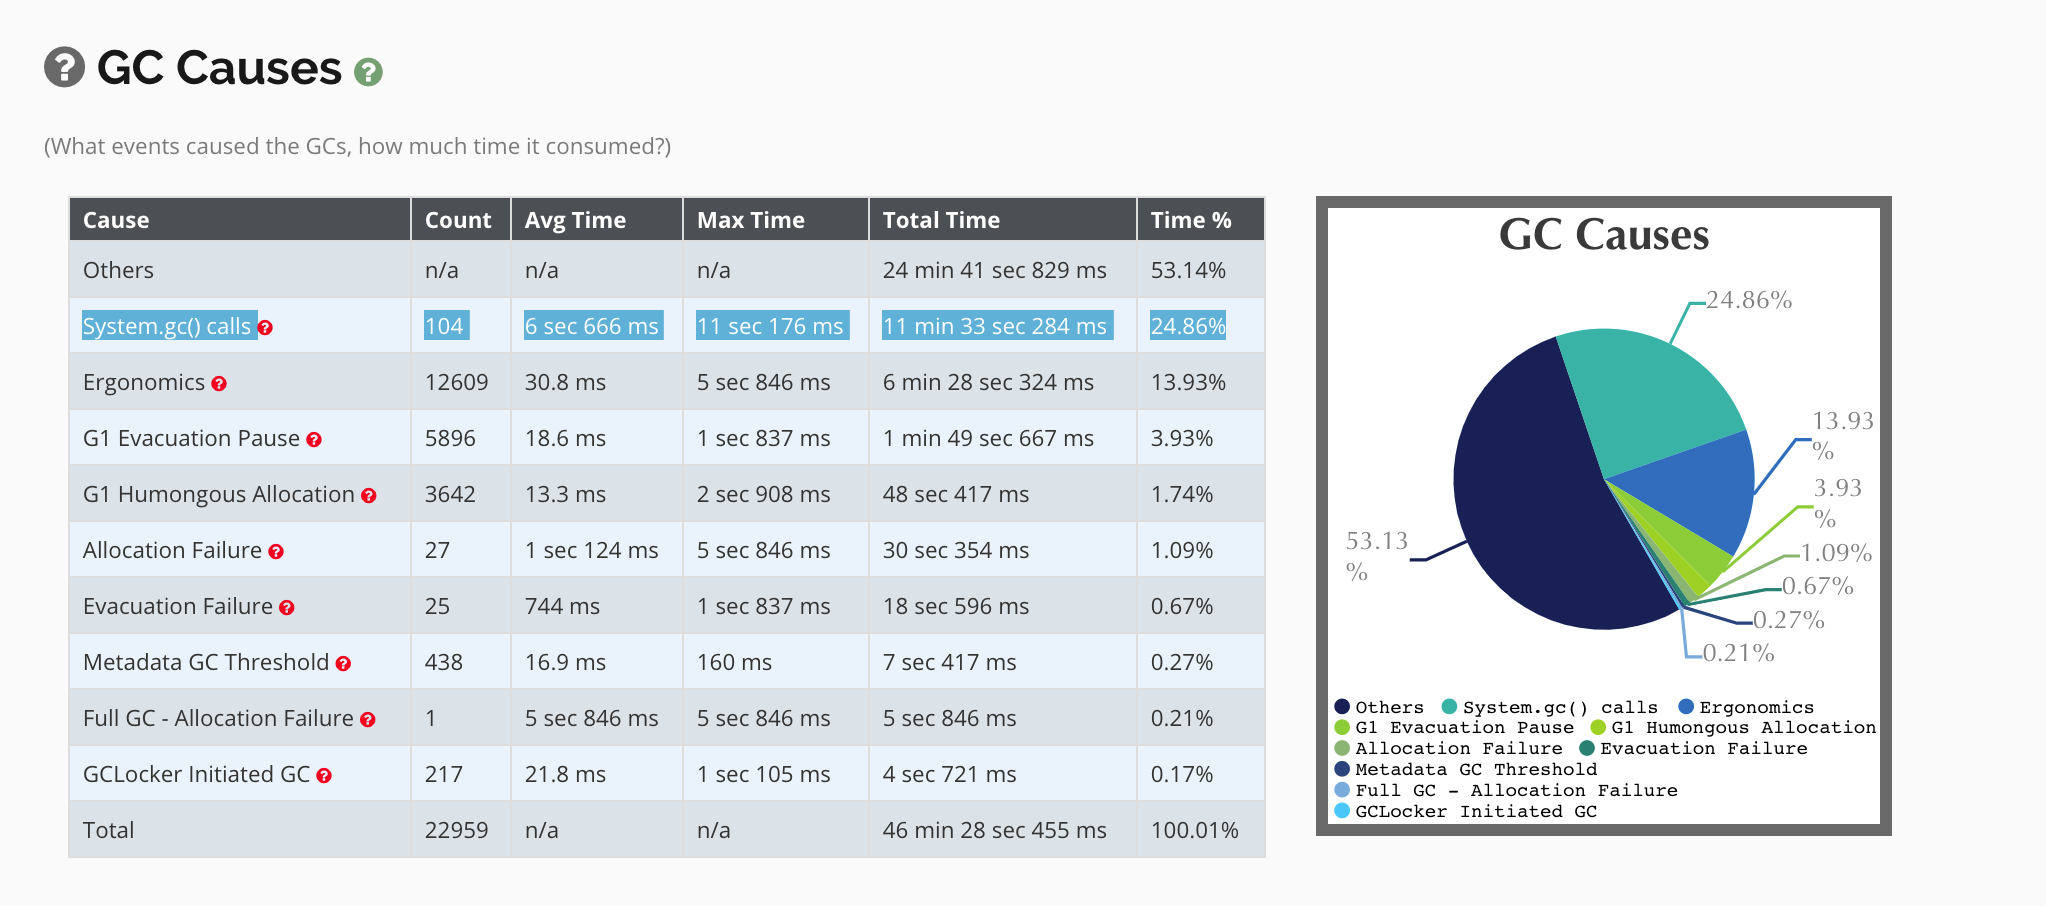
while the Jenkins codebase does not contain system.gc() method calls as a best practice, due to the over 4K plugins available for Jenkins, sometimes a plugin developer will use this method;
in this case the addition of the -XX:+DisableExplicitGC JVM arg resolved this issue;